A Case Study in Content Marketing with Infographics

As I have discussed on other recent blogs the lines between digital marketing and traditional marketing and PR are blurring rapidly. In some cases, such as with SEO and social media, the lines have disappeared completely. Digital content marketing is imperative for supporting a businesses’ integrated online marketing strategy.
About Content Marketing
Let’s first establish what type of content we are talking about. The best content to be used for digital content marketing, social media, and SEO benefits include:
- Blogs
- Videos
- Infographics
- Whitepapers
- eBooks
- Webinars
- Podcasts
Content development however takes time and commitment from your team and should (in my opinion) be led from the top down in your organization. Consumers identify more readily with a brand when owners, and C-Level executives are involved in thought leadership, content development, and social media.
What are Infographics?
Infographics are just what they sound like. They are graphical images that provide information and tell a story. The benefits of infographics over other types of content like a blog article include:
- These days people prefer to see images and watch videos over reading copy
- An image is easily sharable through social media
- Images can easily be saved, copy/pasted, etc.
- Infographics are fun and entertaining which fosters viral buzz
- Infographics can be tagged with keywords and have links embedded
Below we will be looking at an example of an infographic, how your business can identify topics and content, and what the potential results can be from the successful creation and deployment of a great infographic.
72 Hour Case Study of Infographic Success
Identifying Your Audience
One of the first most crucial elements to content marketing is understanding your audience and identifying the types of content they will not just enjoy and benefit from but also share with others.
Choosing a Topic
Do your research and find a unique blend of topics that relate to your brand and industry but that are also current and interesting. If there is buzz around a specific topic trending in your businesses’ industry then develop content around that topic with your own unique insight. Sometimes it makes sense simply to create content around a hot topic that you know will generate some buzz and that your audience will enjoy no matter what industry you are in.
In this example IMI chose to combine interesting social media statistics with the current political battle between Obama and Romney. We decided to compare the facts…who is outperforming the other with social media.
Research and Design
This is of course the most important part. Great content takes time to develop, requires accuracy and attention to detail, and should be compelling in all ways. The infographic below took two weeks to design and build. Notice the blend between visual image design and content.
Deployment and Marketing
This is the next most critical element. Great content is very important but getting it in front of your audience is crucial. You want to be targeted in your approach while reaching as many relevant audience members as possible.
When this infographic was ready for deployment, it was launched on a Monday morning which, based on research, was the best day/time to gain the most traction. We posted the infographic on the Internet Marketing Inc. blog and the fun began. We then sent out a link to the whole company encouraging everyone to LIKE it, Tweet it, Share it on Linked In, etc. The results were explosive!
The Results
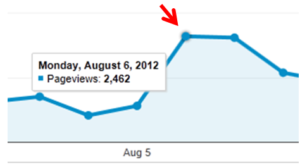
On Monday August 6th we deployed the infographic. Typical pageviews on a Monday are approximately 900. The inforgraphic went viral instantly and generated over 2,400 pageviews that day!
The traffic continued to pour in as the infographic continued to be shared via social media sites. The following two days continued to generate traffic over double the normal Tuesday and Wednesday traffic volumes.
When looking at the Content Overview in Google Analytics you can see which pages of a website are the most viewed. In 24 hours the blog page with the infographic jumped to the third most trafficked page on the website (with almost 3,000 pageviews in 72 hours ) and has remained in that position!
Even more compelling is the data showing the average time on site and amazingly low bounce rate. Average time on site has been almost 13 minutes with a 33% bounce rate!

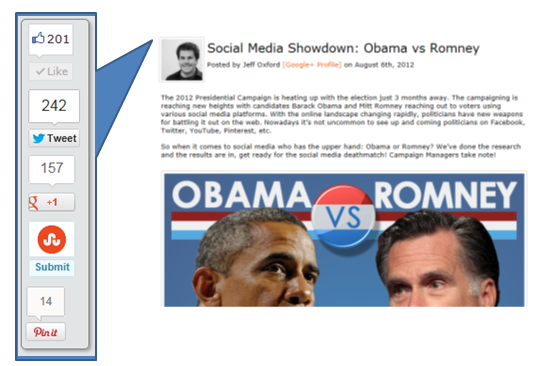
And the reason for all of this traffic and many new inbound links is due to the social media distribution. Take a look at the results in only 72 hours!
Conclusion
An infographic is just one possible strategy for content marketing. The same can be done with videos, blogs, whitepapers, eBooks, Podcasts, and webinars.
Just follow these simple steps:
- Understand what your audience will enjoy
- Choose topics that are relevant but also current and interesting
- Do your research and create a compelling design
- Deploy and distribute through social media channels
Category: Customer Engagement
Tags: Marketing, SEO, Social Media


Really helpful!